

- Introduction
- Function Introduction
- Performance Monitor
- Fusion Hunter
- Quantitative Chart
- SEC Filing
- Insider Trading (Search by Ticker)
- Insider Trading (Search by Reporter)
- Insider Trading (Top Insider Trading)
- Institutional Holdings
- Investment Trends (Investment Company List)
- Investment Trends (Sector & Industry Sentiment)
- Investment Trends (Investment Company Sentiment)
- Investment Trends (Top Institutional Trading)
- Investment Trends (Top Institutional Hldg Change)
- Key Ratio Distribution
- Screener
- Financial Statement
- Key Metrics
- High Current Difference
- Low Current Difference
- Relative Strength Index
- KDJ
- Bollinger Bands
- Price Earnings Ratio
- Price to Book Value
- Debt Equity Ratio
- Leverage Ratio
- Return on Equity
- Return on Assets
- Gross Margin
- Net Profit Margin
- Operating Margin
- Income Growth
- Sales Growth
- Quick Ratio
- Current Ratio
- Interest Coverage
- Institutional Ownership
- Sector & Industry Classification
- Data Portal
- API
- SEC Forms
- Form 4
- Form 3
- Form 5
- CT ORDER
- Form 13F
- Form SC 13D
- Form SC 14D9
- Form SC 13G
- Form SC 13E1
- Form SC 13E3
- Form SC TO
- Form S-3D
- Form S-1
- Form F-1
- Form 8-k
- Form 1-E
- Form 144
- Form 20-F
- Form ARS
- Form 6-K
- Form 10-K
- Form 10-Q
- Form 10-KT
- Form 10-QT
- Form 11-K
- Form DEF 14A
- Form 10-D
- Form 13H
- Form 24F-2
- Form 15
- Form 25
- Form 40-F
- Form 424
- Form 425
- Form 8-A
- Form 8-M
- Form ADV-E
- Form ANNLRPT
- Form APP WD
- Form AW
- Form CB
- Form CORRESP
- Form DSTRBRPT
- Form EFFECT
- Form F-10
- Form F-3
- Form F-4
- Form F-6
- Form F-7
- Form F-9
- Form F-n
- Form X-17A-5
- Form F-X
- Form FWP
- Form G-405
- Form G-FIN
- Form MSD
- Form N-14
- Form N-18F1
- Form N-18F1
- Form N-30B-2
- Form N-54A
- Form N-8A
- Form N-CSR
- Form N-MFP
- Form N-PX
- Form N-Q
- Form TTW
- Form TA-1
- Form T-3
- Form SC 14F1
- Form SE
- Form SP 15D2
- Form SUPPL
- Form 10-12G
- Form 18-K
- Form SD
- Form STOP ORDER
- Form TH
- Form 1
- Form 19B-4(e)
- Form 40-APP
- Form 497
- Form ABS-15G
- Form DRS
- Form MA
- Form UNDER
- AI sentiment
- Access guide
- Academy
- Term of service
- GDPR compliance
- Contact Us
- Question Center
| Font Size: |
Price to Book Value
Price to book value (P/B ratio) measures how much dollars investors need to pay to get one dollar equity. It is calculated through dividing market price per share by book value per share (without excluding intangible assets) presented in consolidated balance sheet of a company. P/B ratio has industry and sector specific distribution. When comparing two companies within the same industry, or sector, generally the one with lower P/B ratio (if not negative) is more preferred (assuming other financial metrics are the same). Similar to price earnings ratio, the inverse of P/B ratio (i.e. B/P) is used to generate quantile ranking score [0~1]. High score (closer to 1) represents relatively low P/B ratio and better performance. Low score (closer to 0) represents relatively high P/B ratio and poorer performance. Negative P/B ratios (due to negative equity) always have the lowest scores and will be shown in pink color in performance monitor. It is noteworthy that there is no specific interpretation for negative P/B ratio. While a low P/B ratio might represent a company is undervalued, investors are generally cautious of extremely low P/B ratio (e.g. a positive number less than 1), which could mean something fundamentally wrong with a company.
Example 1: Google Inc. (NASDAQ:GOOG) has P/B ratio of 3.92 as the end of Nov 05 2016. Apple Inc. (NASDAQ:AAPL) has P/B ratio of 4.57|
GOOG Price/Book Value: 3.92
|
AAPL Price/Book Value: 4.57
|
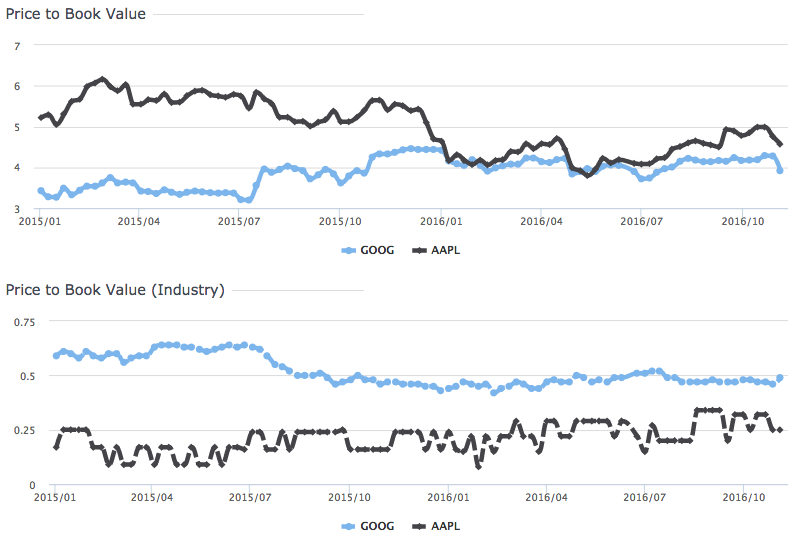
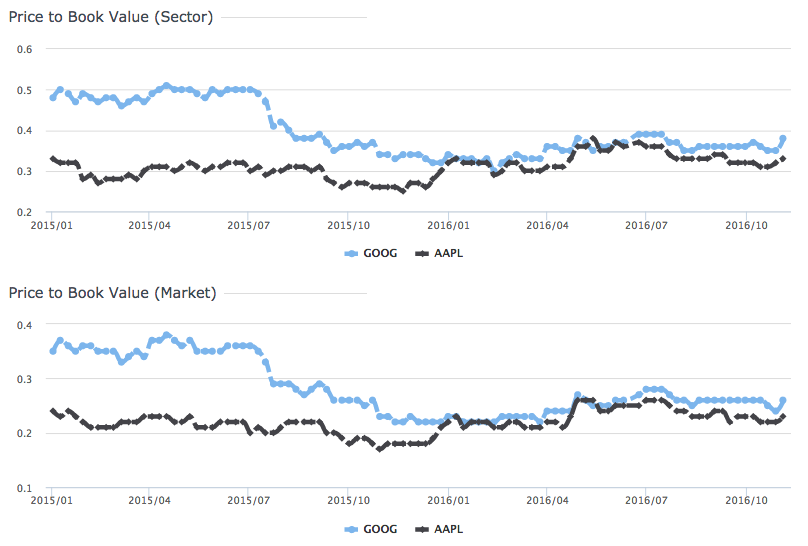
The figures above indicate investors need to pay 3.92 and 4.57 dollar for 1 dollar equity of GOOG and AAPL, respectively. Their P/B ratio are lower than 49% and 25% of corresponding industry peers (Note they belong to different industries), respectively. At the whole market level, they are lower than 26% and 23% of other stocks, respectively. The data indicate the equity price of GOOG and AAPL are pretty expensive compared with market average. While at industry level, GOOG is a better choice than AAPL.
Historical Data
Analysis of historical data in the past 2 years (as of Oct 2016) indicates the P/B ratio of GOOG is increasing, and AAPL is decreasing. The performance of GOOG compares to its industry peers ("Prepackaged Software/Programming/Edp Services") is constantly better than the performance of AAPL compares to its industry peers ("Computer Manufacturing"). At sector and the whole market level, GOOG and AAPL converged to similar performance at the beginning of 2016.

